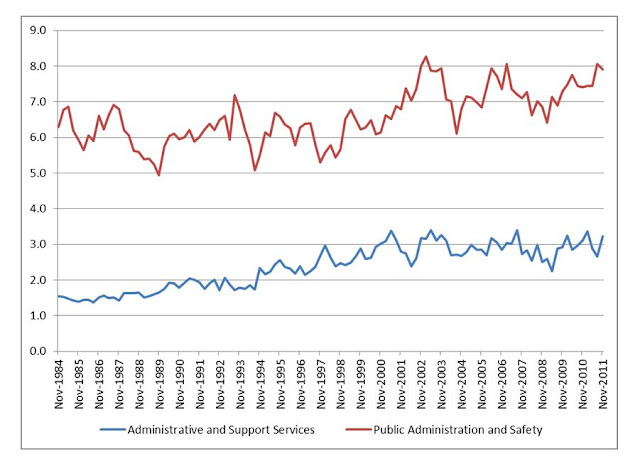
My post from the other day on employment and industry structure in Queensland contains data up to 2009-10. The following graph provides an outline of long-term employment trends by industry as a percentage of total employment, up to November 2011 (thanks to Mick Peel for pointing this out).
The percentage data and the graphics are quite revealing of the changes in Australia since 1984.
I tried putting all of the sectors on the one graph, but it looked like something Barry Jones or Kim Beazley might have designed, so I decided to separate them out for your viewing pleasure.
Remember that these graphs don't represent absolute levels of employment in the economy, just their relative importance as a percentage of total Queensland employment. Note too that scales are different for different charts. Raw data file available on request.
 Agriculture and manufacturing are big losers over this time period and remember that they had already been losing employees from well before 1984. Mining has virtually doubled in size, but still accounts for less than 4% of total employment. Construction has also grown, perhaps matching increased investment in housing and more recently in construction associated with mining and other infrastructure. That downturn in construction from 2007 to late 2011 could have been a lot worse without government assistance to the construction sector.
 Wholesale and retail trade have not had the continuous decline of agriculture and manufacturing, but have done poorly in recent times, apart from an upturn for Accommodation and Food 2008-09.
It's important to remember that changes in employment may represent the decline of an industry or improvements in productivity. Those of you who grew up in the 1970s and 1980s (or before) will well remember how much more service was provided in certain retail sectors for example. Petrol stations are an obvious example, but "self serve" is a late 20th century phenomenon generally.
 Professional, scientific and Technical services employment has grown rapidly since the early 1980s, while sadly education and training has remained fairly static as a percentage of the whole. I must admit that I thought that Financial and Insurance Services might have garnered a larger percentage, but this might represent the fact that Queensland jobs in finance etc might have shifted to Sydney or Melbourne.

 Unsurprisingly Health Care and Social Assistance has increased significantly in recent years as have Arts and Recreation Services. Expect both of them to keep increasing their stake over coming years as the population ages and as young people increasingly "service" the recreation and health needs of cashed-up baby boomers.
Putting all the lines together reminded me of the start of that Barracudas song from the 1980s "Summer Fun". "ba ba ra ra cu cu da da"

The percentage data and the graphics are quite revealing of the changes in Australia since 1984.
I tried putting all of the sectors on the one graph, but it looked like something Barry Jones or Kim Beazley might have designed, so I decided to separate them out for your viewing pleasure.
Remember that these graphs don't represent absolute levels of employment in the economy, just their relative importance as a percentage of total Queensland employment. Note too that scales are different for different charts. Raw data file available on request.


It's important to remember that changes in employment may represent the decline of an industry or improvements in productivity. Those of you who grew up in the 1970s and 1980s (or before) will well remember how much more service was provided in certain retail sectors for example. Petrol stations are an obvious example, but "self serve" is a late 20th century phenomenon generally.


Putting all the lines together reminded me of the start of that Barracudas song from the 1980s "Summer Fun". "ba ba ra ra cu cu da da"

No comments:
Post a Comment
Please be civil ...